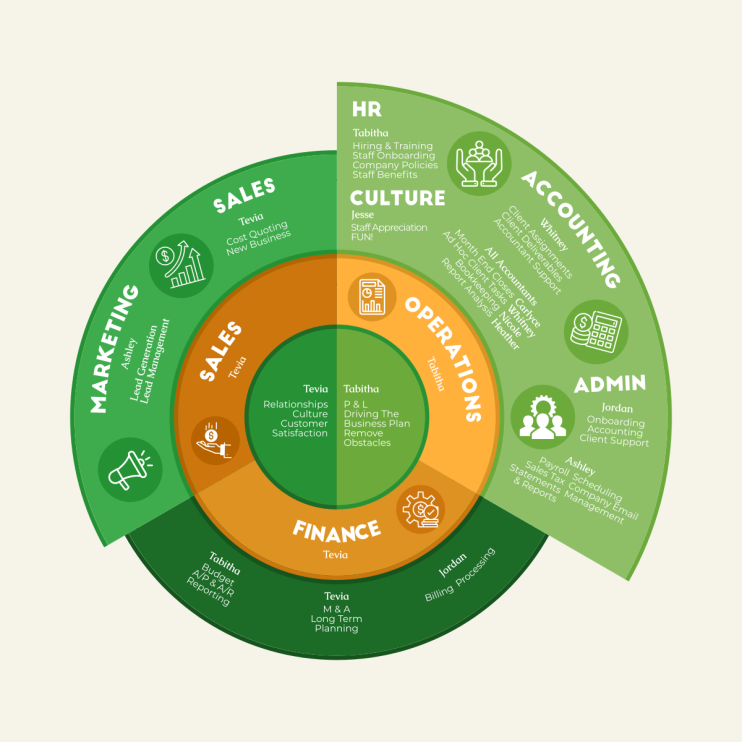
When I was asked to design a hierarchy chart for TeKoda Accounting, I knew I wanted to create something unique and visually engaging. Traditional hierarchy charts can be dull and difficult to interpret, so I decided to take an out-of-the-box approach by designing an infographic-style hierarchy chart using vector graphics.
I wanted the chart to be easy to follow at a glance but also have enough detail to provide useful information about each role.
The beauty of working with vectors is that they can be easily resized without losing any quality or clarity. This meant that the hierarchy chart could be printed as a large poster for display in the office or scaled down for use on digital platforms like email or social media.
The end result was a vibrant and dynamic infographic-style hierarchy chart that not only conveyed important information but also added a touch of creativity and modernity to TeKoda Accounting's visual identity.
